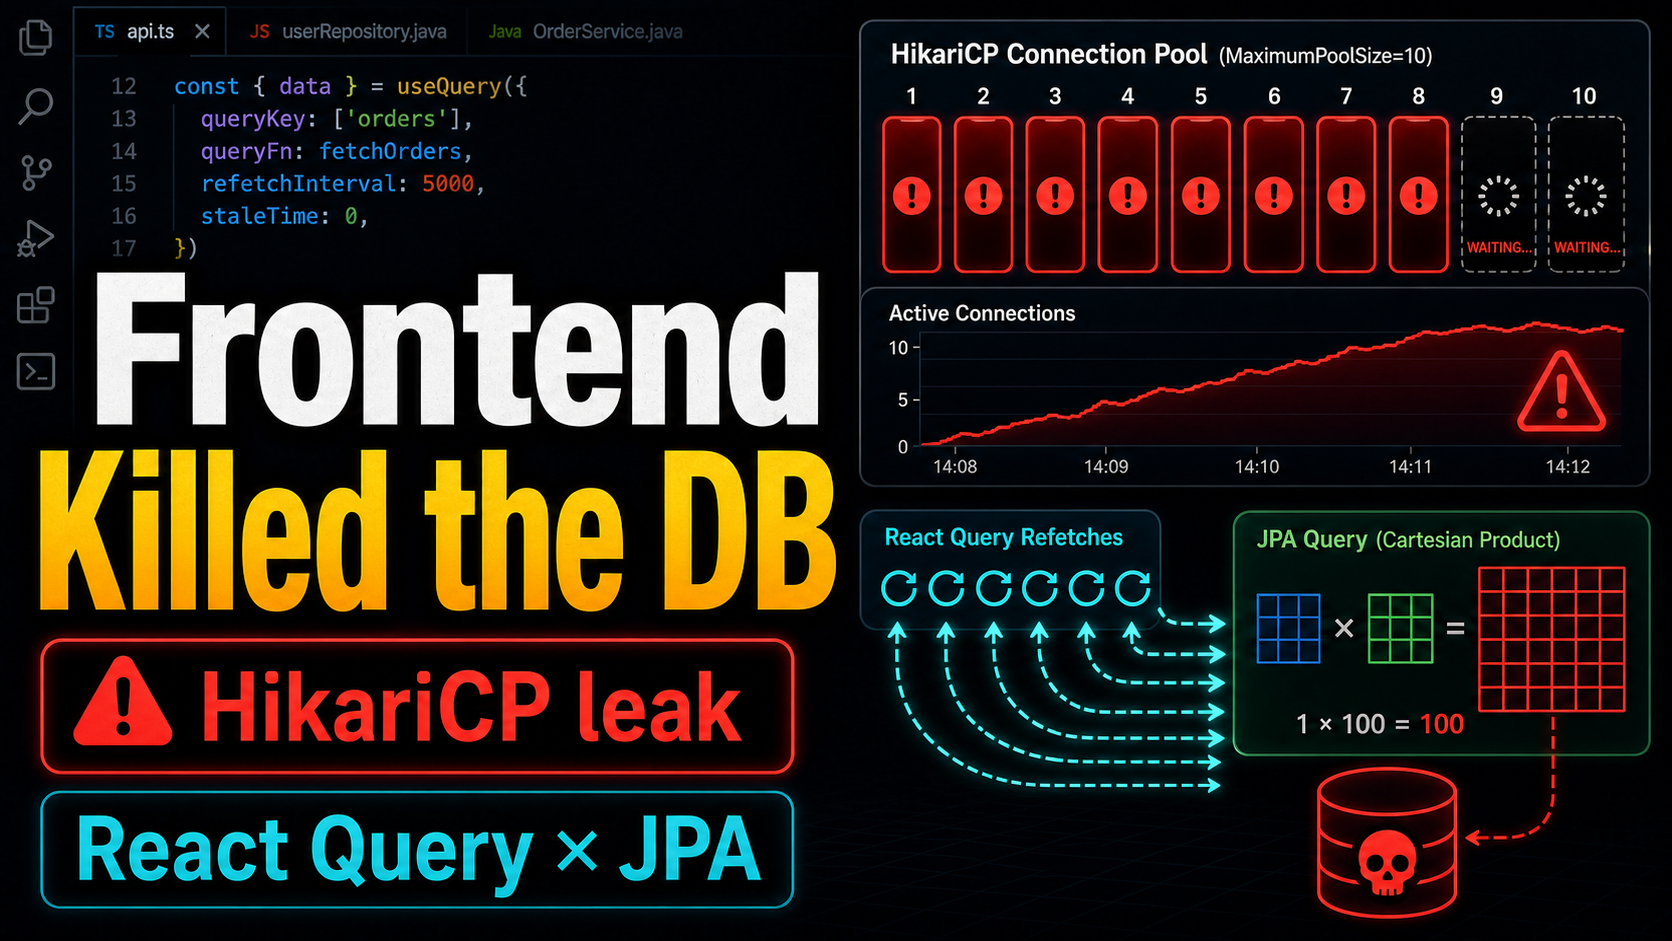
On a Sunday morning, the server stopped responding. Login failed. Other endpoints failed too. The logs showed six Apparent connection leak detected warnings within two seconds.
The DB connection pool was exhausted. The root cause was not just one slow backend query. A frontend refetch pattern amplified that slow query until it occupied most of the pool. The interesting part: I had found and fixed the same backend anti-pattern in another area one month earlier.
Incident Scene
HikariCP logs:
02:51:38 WARN Connection leak detected (thread tomcat-handler-5188)
02:51:39 WARN Connection leak detected (thread tomcat-handler-5191)
02:51:40 WARN Connection leak detected (thread tomcat-handler-5204)
02:51:40 WARN Connection leak detected (thread tomcat-handler-5205)
02:51:40 WARN Connection leak detected (thread tomcat-handler-5206)
02:51:40 WARN Connection leak detected (thread tomcat-handler-5211)
The connection pool size was 10. Six connections were flagged as leaks. The stack traces pointed to two list APIs:
at TaskListController.listItems(...)
at TaskListController.listDynamicItems(...)
Both APIs were holding DB connections for too long.
Cause 1: Cartesian Product on the Backend
The listItems query looked like this:
@Query("SELECT DISTINCT t FROM Task t " +
       "LEFT JOIN FETCH t.assignees " +   // @ManyToMany collection
       "LEFT JOIN FETCH t.tags " +        // @ElementCollection collection
       "WHERE t.orgId = :orgId")
It fetch-joined two collections at the same time.
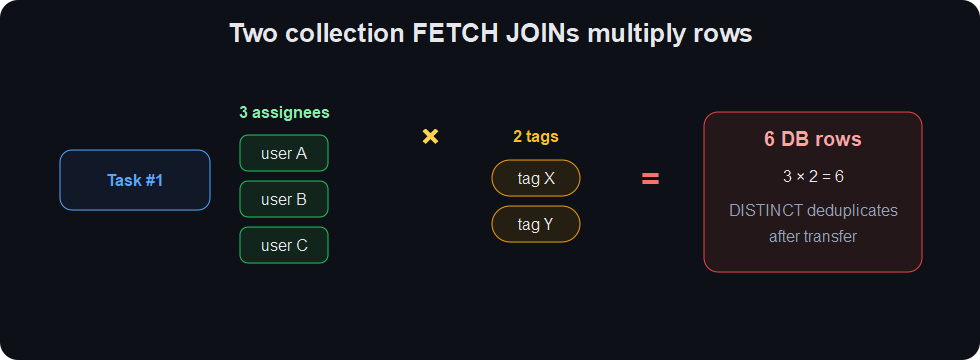
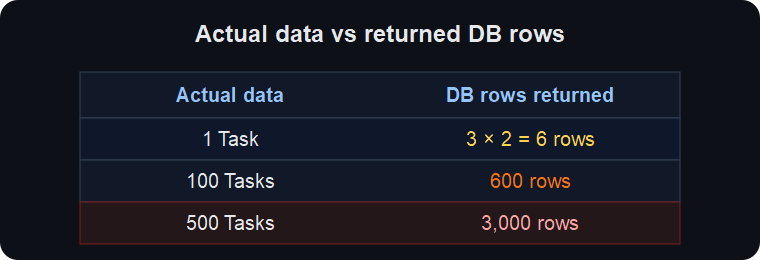
DISTINCT does not reduce the amount of data transferred from the DB to the application. Hibernate deduplicates entities in memory after the rows arrive. As data grew, the query started taking more than 30 seconds.
Fix
Remove JOIN FETCH for tags and use @BatchSize instead:
// add BatchSize to the Entity
@ElementCollection(fetch = FetchType.LAZY)
@BatchSize(size = 100)
private Set<String> tags = new HashSet<>();

// fetch only one side in the Repository
@Query("SELECT DISTINCT t FROM Task t " +
       "LEFT JOIN FETCH t.assignees " +
       "WHERE t.orgId = :orgId")
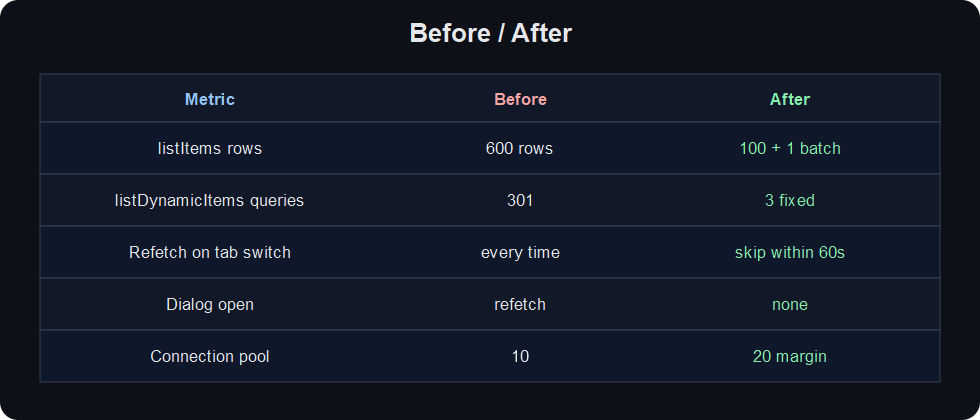
For 100 tasks: 600 rows became 100 rows plus one batch query.
Cause 2: Correlated Subqueries on the Backend
listDynamicItems had another problem. It queried active members with no scheduled future event:
SELECT mp,
    (SELECT MAX(e.occurredAt) FROM Event e
     WHERE e.userId = up.userId AND e.occurredAt < :now),
    (SELECT MAX(t.firstActivityAt) FROM MemberTransition t
     WHERE t.memberProfile = mp AND ...),
    (SELECT MAX(t.activatedDate) FROM MemberTransition t
     WHERE t.memberProfile = mp AND ...)
FROM MemberProfile mp
WHERE ...
There are three correlated subqueries in the SELECT clause. For N active members, the DB internally executes the subquery cost about 3N times. If N is 100, one SQL statement carries the cost of about 301 query operations.
Fix: two-step batch query
// Step 1: main query without SELECT subqueries
List<MemberProfile> profiles = entityManager.createQuery("""
    SELECT mp FROM MemberProfile mp
    JOIN FETCH mp.userProfile up
    JOIN FETCH up.user u
    WHERE mp.orgId = :orgId
    AND mp.status = :activeStatus
    AND NOT EXISTS (...)
    """, MemberProfile.class).getResultList();

// Step 2a: last event time, batched
Map<Long, LocalDateTime> lastEventMap = entityManager.createQuery("""
    SELECT e.userId, MAX(e.occurredAt)
    FROM Event e
    WHERE e.userId IN :userIds AND e.occurredAt < :now
    GROUP BY e.userId
    """, Object[].class).getResultList()...;

// Step 2b: first activity / activation date, batched
Map<Long, Object[]> transitionMap = entityManager.createQuery("""
    SELECT t.memberProfile.id,
           MAX(t.firstActivityAt),
           MAX(t.activatedDate)
    FROM MemberTransition t
    WHERE t.memberProfile.id IN :profileIds AND ...
    GROUP BY t.memberProfile.id
    """, Object[].class).getResultList()...;
N × 3 subquery work became 3 fixed queries. The query count no longer grows with N.
Cause 3: Frontend Amplifier
The slow backend queries were the necessary condition. The sufficient condition was on the frontend.
staleTime = 0
React Query’s default staleTime is 0. Data becomes stale immediately after it is fetched. That means:
User action                          React Query behavior
─────────────────────────            ────────────────────
tab switch / focus lost       ────►   refetch on next focus
component mount/unmount       ────►   refetch on remount
return from another page      ────►   refetch because data is stale
window focus regain           ────►   refetch by default

  → one user's navigation repeats two 30-second queries
Every time a user opened the list tab, visited another page, and returned, the two 30-second queries ran again.
Unnecessary invalidation
Opening a detail dialog also ran this:
useEffect(() => {
  if (open) {
    queryClient.invalidateQueries({ queryKey: ['dynamicItems'] });
  }
}, [open]);
Every card click forced the entire list query to refetch. invalidateQueries bypasses staleTime and immediately sends a server request.
Combined effect
One user opens the list page:
  → listItems         (1 connection, held for 30s)
  → listDynamicItems  (1 connection, held for 30s)
  = 2 connections × 30s

Three users at the same time:
  = 6 connections × 30s
  → 6 of 10 pool slots are exhausted
  → all other endpoints, including login, wait on the remaining 4
The six leak warnings in the logs match this scenario.
Fix
// add staleTime: keep data fresh for 60 seconds
const { data: dynamicItems } = useQuery({
  queryKey: ['dynamicItems'],
  queryFn: () => api.listDynamicItems(),
  staleTime: 60_000,
});

// remove invalidation when opening the dialog
useEffect(() => {
  if (open && item.type === 'PENDING_REVIEW') {
    setExpandedUsers(new Set(item.subItems.map(s => s.userId)));
  }
}, [open, item.type, item.subItems]);
User actions that mutate data, like completing a reservation or changing status, still call invalidateQueries. staleTime only prevents automatic refetches when nothing has changed.
Why Did This Happen Again?
One month earlier, I found and fixed the same dual collection FETCH JOIN pattern in another domain. I even wrote an insight document about it. But I did not know the same pattern existed in Task until this incident.
After the incident, I audited every FETCH JOIN query across 58 repositories. Aside from Task, only one risky dual collection FETCH JOIN remained, and it was in a QA test tool with no production impact.
The lesson is direct: when you find an anti-pattern, do not fix only that file. Search the entire codebase for the same shape. grep is enough.
# find similar patterns
grep -r "JOIN FETCH" --include="*.java" src/ | \
  awk -F: '{print $1}' | sort | uniq -c | sort -rn | \
  awk '$1 > 2 {print}'
Before / After
Lessons Learned
-
A slow backend query gets amplified by the frontend. A 1-second query with
staleTime = 0may be fine. A 30-second query withstaleTime = 0can exhaust the connection pool. -
Finding an anti-pattern means auditing for the pattern. “I fixed this file” is not enough. Similar code often exists elsewhere in the same codebase.
-
A correlated subquery in SELECT is invisible N+1. The application sees one query, but the DB performs row-dependent subquery work internally. If suspicious, split it into batch queries.
-
invalidateQueriesbypassesstaleTime. No matter how long your stale time is, invalidation triggers a refetch. Read-only UI flows should not invalidate list queries.
Comments