While building a learning management system, I noticed a popover showing a blank white box for about a second when clicking a student’s status badge. What started as a simple frontend loading state fix escalated into auditing all 56 Response DTOs across the server and fixing 4 CRITICAL N+1 query issues.
This post covers:
- Tracing a server query problem from a frontend UX issue
- The pattern where JPA LAZY Loading causes N+1 in Response DTO conversions
- How to audit an entire project for this pattern
- Writing query count regression tests with Hibernate Statistics
Discovering the Problem
In the student list, clicking a status badge (e.g., “Enrolling”, “Active”) opens a popover with enrollment details. But after clicking, a completely empty white box appeared for about a second before content loaded.

The popover was intentionally using lazy fetch — to avoid an N+1 problem where each student row would trigger its own API call, the design only fetched enrollment records when the popover opened. A reasonable design, but it left users staring at a blank box during loading.
Step 1: Frontend Quick Fix
Two changes to address the blank box immediately.
Loading spinner: Show a spinner instead of an empty box while data loads.
{isLoadingRecord && (
  <div className="flex items-center justify-center py-3">
    <Loader2 className="h-5 w-5 animate-spin text-gray-400" />
  </div>
)}
Hover prefetch: Start fetching data the moment the user hovers over the badge. By the time they click (~200-500ms later), the data is already cached and the popover renders instantly.
const handleMouseEnter = useCallback(() => {
  if (isPending) {
    prefetchRecordsByUser(queryClient, studentId);
  }
}, [isPending, queryClient, studentId]);
export const prefetchRecordsByUser = (
  queryClient: QueryClient, userId: number
) => {
  queryClient.prefetchQuery({
    queryKey: keys.byUser(userId),
    queryFn: () => api.getRecordsByUser(userId),
    staleTime: 30_000, // prevent duplicate requests within 30s
  });
};
Setting staleTime: 30_000 ensures that hovering over the same student again within 30 seconds won’t trigger another request.
Step 2: Server Query Analysis
The frontend was fixed, but could the server response time itself be reduced?
Looking at the server code for this API:
public List<TransitionResponse> getTransitionsByUserId(Long targetUserId) {
    StudentCampusProfile scp = scpRepository
            .findByUserIdAndCampusId(targetUserId, campusId)
            .orElseThrow(...);

    return transitionRepository
            .findByScpIdOrderByCreatedAtDesc(scp.getId())
            .stream()
            .map(TransitionResponse::from)  // problem here
            .collect(Collectors.toList());
}
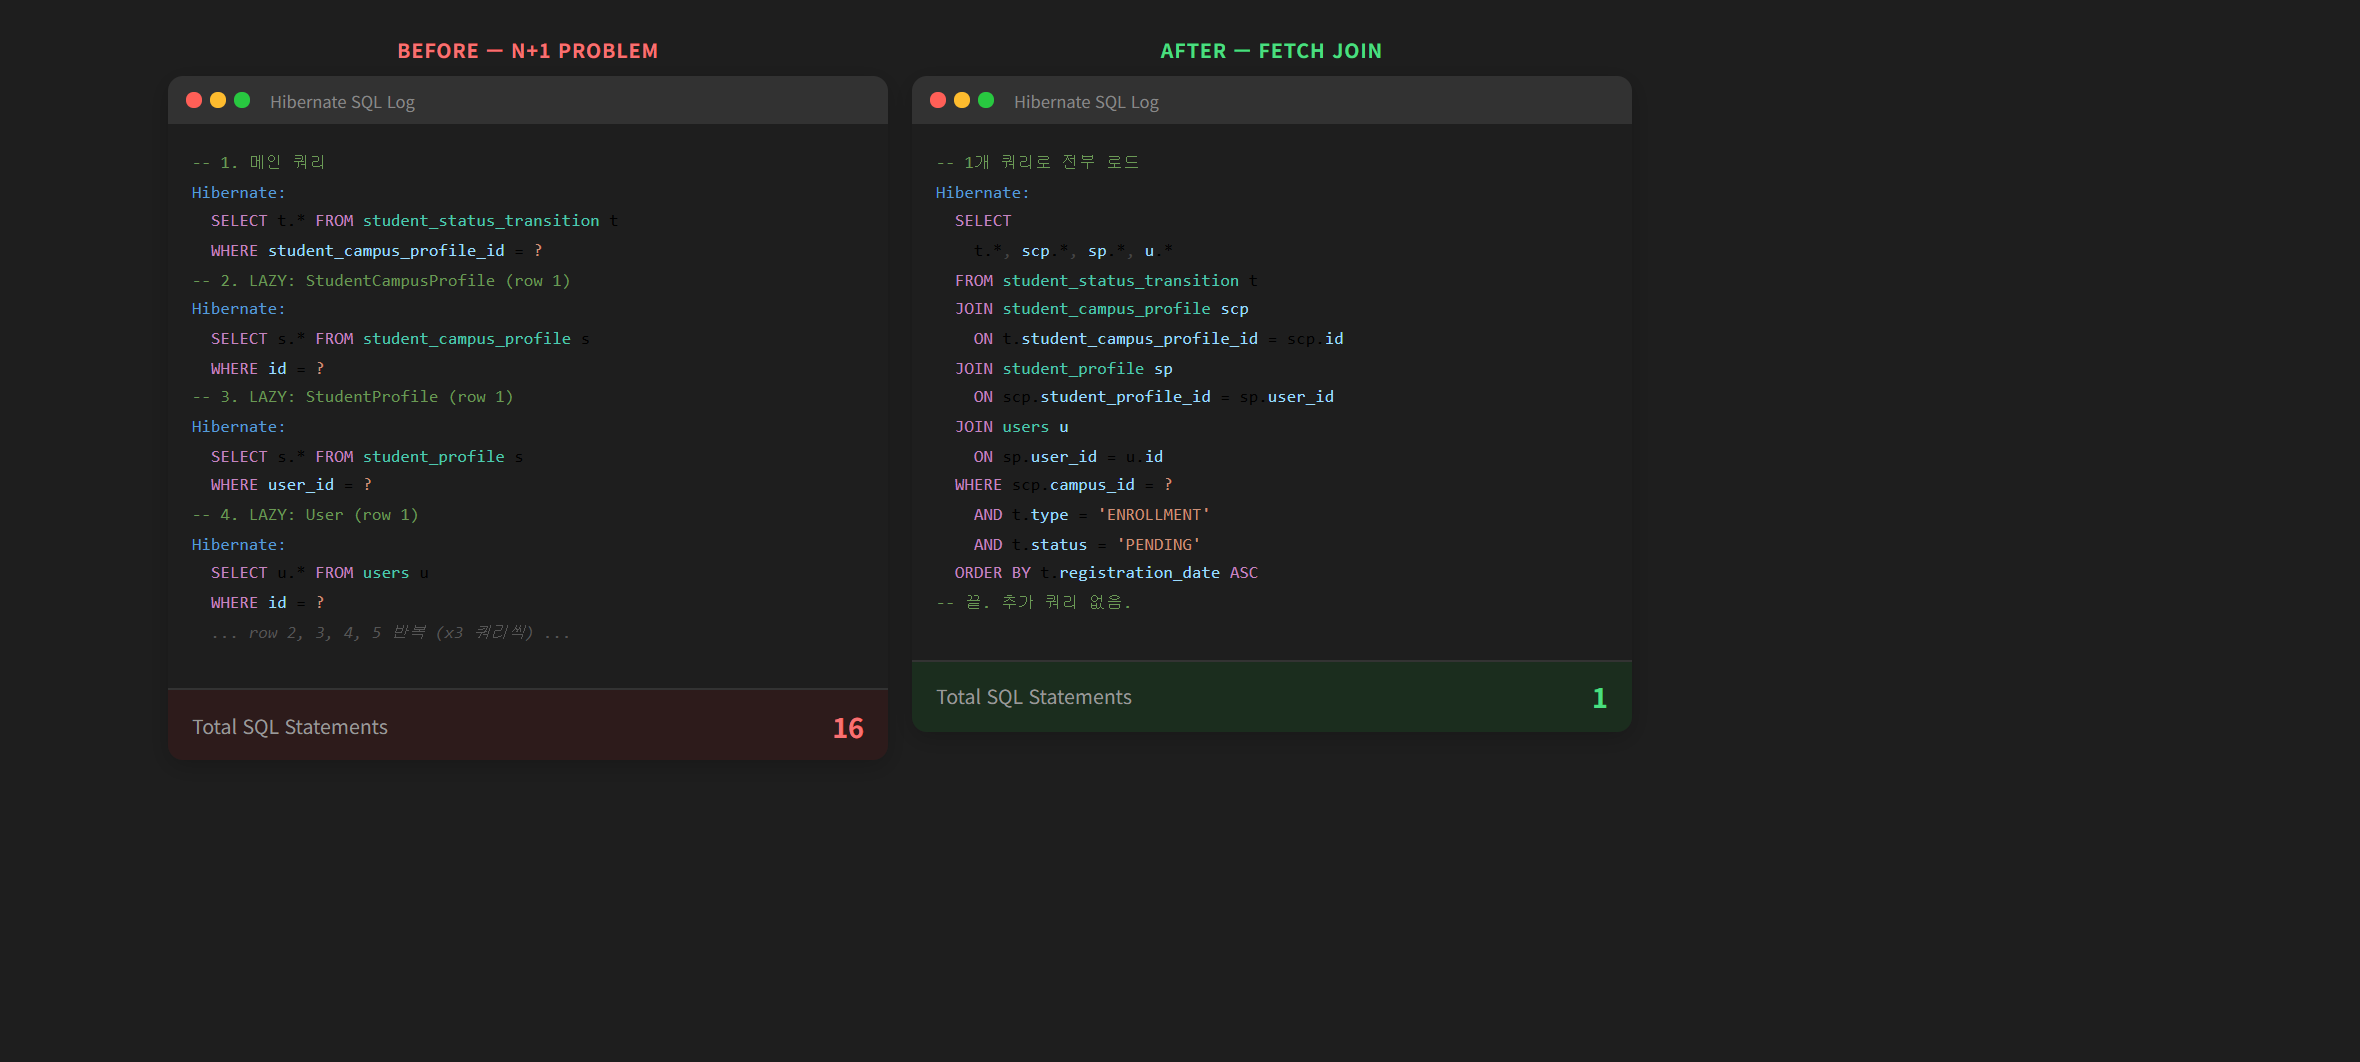
findByScpIdOrderByCreatedAtDesc is a Spring Data JPA derived query — no FETCH JOIN. But TransitionResponse.from() accesses:
public static TransitionResponse from(Transition transition) {
    // LAZY association access → additional queries!
    var scp = transition.getStudentCampusProfile();   // query 1
    var sp = scp.getStudentProfile();                 // query 2
    var user = sp.getUser();                          // query 3
    builder.studentName(user.getName());
}
Three levels of LAZY associations: Transition → StudentCampusProfile → StudentProfile → User. For N records, up to 3N additional queries fire.
Step 3: Applying FETCH JOIN
The fix is straightforward — add FETCH JOIN to the repository query.
// Before: derived query (no FETCH JOIN)
List<Transition> findByScpIdOrderByCreatedAtDesc(Long scpId);

// After: FETCH JOIN loads all associated entities in one query
@Query("SELECT t FROM Transition t " +
       "JOIN FETCH t.studentCampusProfile scp " +
       "JOIN FETCH scp.studentProfile sp " +
       "JOIN FETCH sp.user " +
       "WHERE scp.id = :scpId " +
       "ORDER BY t.createdAt DESC")
List<Transition> findByScpIdWithProfileOrderByCreatedAtDesc(
    @Param("scpId") Long scpId);
Step 4: Full Project Audit
If this pattern existed here, it likely existed elsewhere. I audited all 56 Response DTOs’ from() methods across the project.
Audit criteria:
- Does the Response DTO have a
from()/toDto()conversion method? - Does that method access LAZY associations (
@ManyToOne(fetch = LAZY), etc.)? - Does the calling Repository query include FETCH JOIN for those associations?
Result: 4 CRITICAL issues found
| Response DTO | LAZY access chain | Before (5 rows) | After |
|---|---|---|---|
| WaitingRequestResponse | SCP → StudentProfile → User | 17 | 1 |
| TransitionResponse | SCP → StudentProfile → User | 16 | 1 |
| InquiryResponse | targets(OneToMany) → User, Campus | 17 | 7 |
| SeatReservationResponse | SeatGroup → Room, User, NextUser | 8 | 1 |
InquiryResponse lands at 7 instead of 1 because @OneToMany collection FETCH JOINs don’t always resolve to a single query. Still, 17 → 7 is a significant improvement.
Step 5: Regression Tests
Adding FETCH JOIN isn’t the end. Someone could later modify a query and accidentally drop the FETCH JOIN. I wrote query count tests using Hibernate’s Statistics.
@DataJpaTest
@ActiveProfiles("test")
class FetchJoinQueryCountTest {

    private Statistics statistics;

    @BeforeEach
    void setUp() {
        EntityManager em = testEntityManager.getEntityManager();
        SessionFactory sf = em.unwrap(Session.class).getSessionFactory();
        statistics = sf.getStatistics();
        statistics.setStatisticsEnabled(true);
    }

    @Test
    void waitingRequest_findActiveByClassId_singleQuery() {
        // Given: 3 students waiting
        // ... create test data ...

        testEntityManager.flush();
        testEntityManager.clear();  // clear first-level cache
        statistics.clear();         // reset counters

        // When: execute repository query + access LAZY associations
        List<WaitingRequest> results = repository.findActiveByClassId(classId);
        results.forEach(wr -> {
            wr.getProfile().getStudentProfile().getUser().getName();
        });

        // Then: FETCH JOIN means only 1 query should execute
        assertThat(statistics.getPrepareStatementCount()).isEqualTo(1);
    }
}
Key gotchas:
- Always call
entityManager.clear()beforestatistics.clear(). Otherwise, entities are served from the first-level cache and no queries fire — giving a false “no N+1” result. - Use
getPrepareStatementCount(), notgetQueryExecutionCount(). The latter only counts JPQL executions. Lazy loading triggers SQL through prepared statements, whichgetQueryExecutionCount()misses entirely. This is a subtle but critical distinction — using the wrong counter can lead you to conclude “there’s no N+1” when there absolutely is. - You need
hibernate.generate_statistics: truein your test configuration.
Results
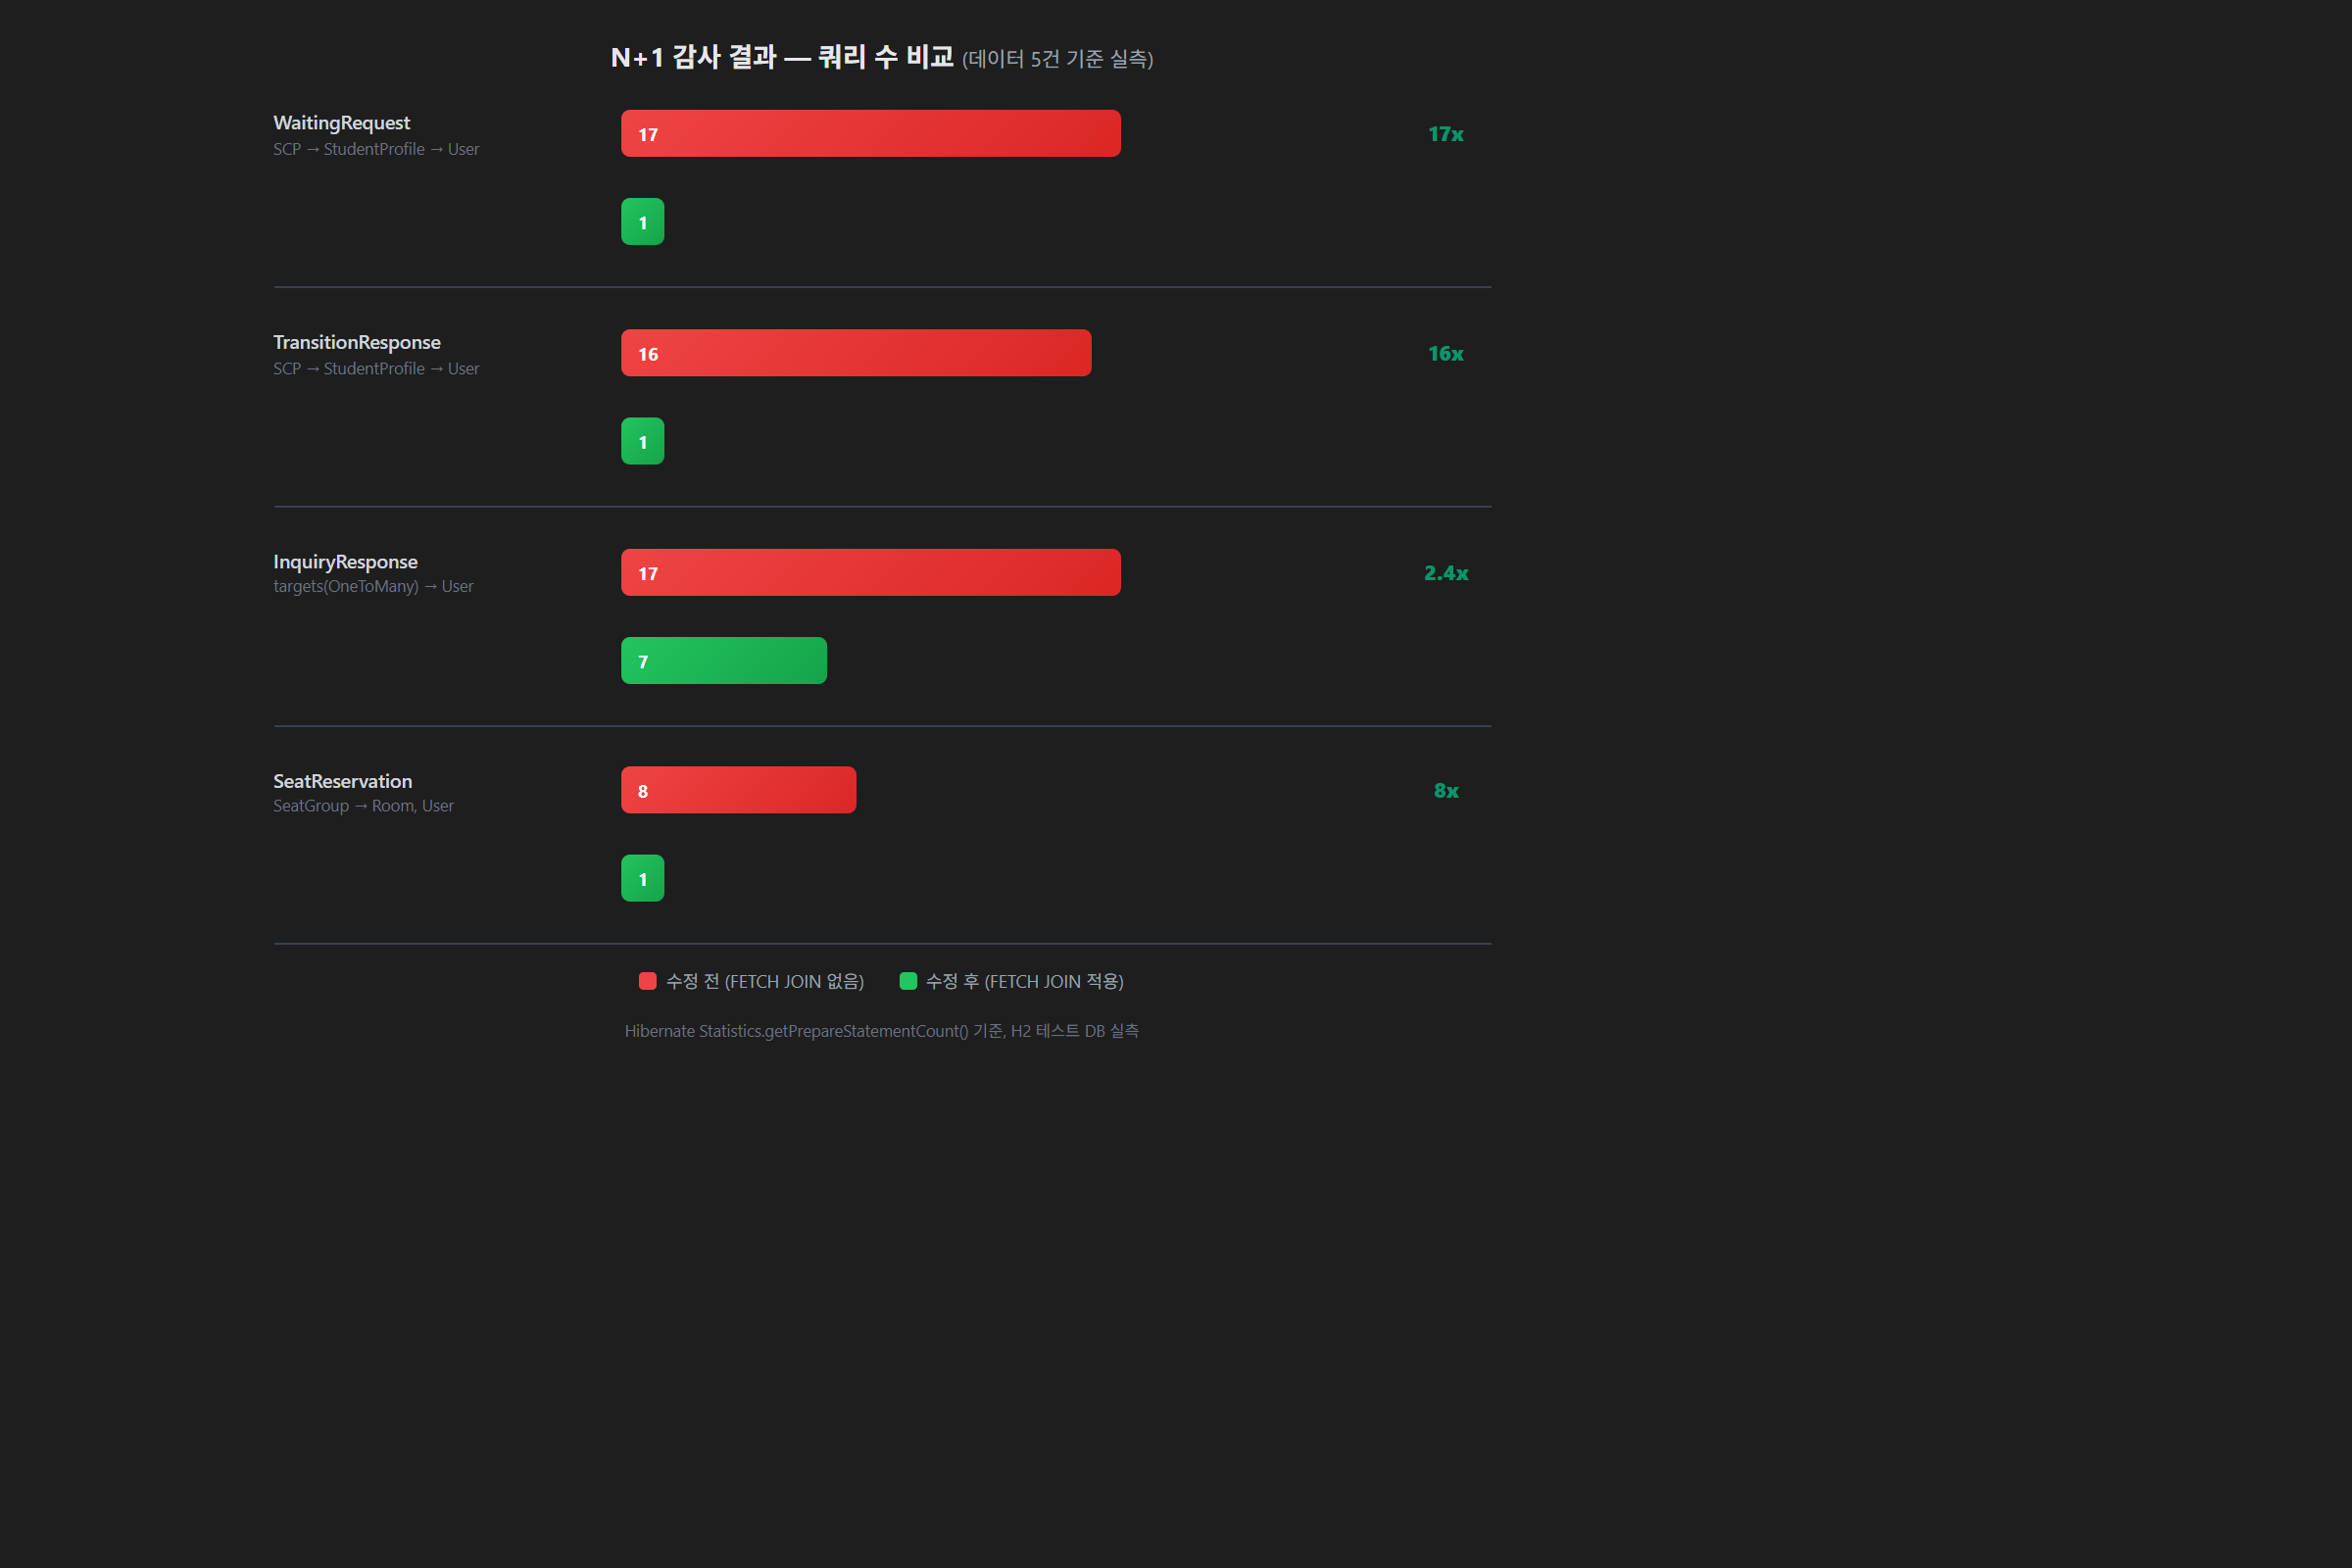
| Target | Before | After | Reduction |
|---|---|---|---|
| WaitingRequest | 17 queries | 1 query | 17x |
| Transition | 16 queries | 1 query | 16x |
| Inquiry | 17 queries | 7 queries | 2.4x |
| Seat | 8 queries | 1 query | 8x |
The gap widens with more data. With 30 students on the waitlist, the pre-fix version would have fired roughly 100 queries.
Qualitative improvements:
- UX: Blank popover box → instant render (hover prefetch)
- Codified rule: Added “LAZY Loading N+1 Prevention” to coding guidelines — automatically enforced in future development
- Regression safety: Query count tests catch missing FETCH JOINs in CI
Lessons Learned
1. Server problems hide behind UX issues
“It’s loading slow” could be a frontend issue, a server issue, or both. In this case, both sides had room for improvement. Looking at only one side solves only half the problem.
2. The derived query trap
Spring Data JPA’s derived queries (findByXxxOrderByYyy) are convenient but don’t support FETCH JOIN. If your DTO conversion accesses LAZY associations, you must use @Query with explicit FETCH JOIN.
3. Use getPrepareStatementCount()
When verifying N+1 with Hibernate Statistics, getQueryExecutionCount() only counts JPQL executions. Lazy loading executes SQL via prepared statements internally, so you need getPrepareStatementCount() for accurate numbers. Using the wrong counter can lead to a false “no N+1” conclusion.
4. One finding means audit everything
If you find an N+1 pattern in one place, the same pattern likely exists elsewhere. Auditing all 56 DTOs uncovered 4 additional CRITICAL issues. Codifying the check criteria as a rule prevents the same mistake going forward.
Comments